


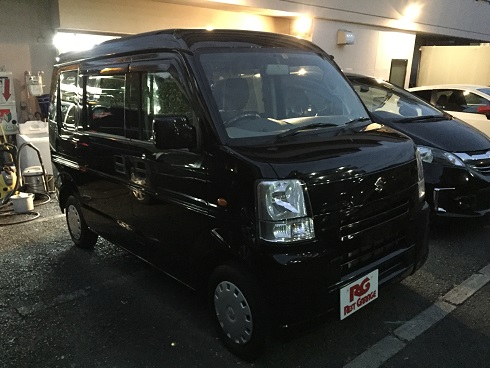
スズキ エブリィ ジョインターボ ご成約ありがとうございます
2016年11月23日
神奈川県 川崎市
N様
スズキ エブリィ ジョインターボ
ご成約ありがとうございます
N様
今年2台目のご購入誠にありがとうございます
今回は快適お仕事用のエブリィ ターボ!
前車のエブリィはNAでしたのでかなり快適に走ると思いますよ
追加で自家用車のスタッドレスタイヤの
ご注文もありがとうございます。
担当 齊藤
  |
|||||
 |
|||||
@restgarage からのツイート |
スズキ エブリィ ジョインターボ ご成約ありがとうございます2016年11月23日 神奈川県 川崎市 N様 スズキ エブリィ ジョインターボ ご成約ありがとうございます N様 今年2台目のご購入誠にありがとうございます 今回は快適お仕事用のエブリィ ターボ! 前車のエブリィはNAでしたのでかなり快適に走ると思いますよ 追加で自家用車のスタッドレスタイヤの ご注文もありがとうございます。 担当 齊藤 |
|||||||||||||||||||||||||||||||||||||||||||||||||||||||||||||||||||||||||||||||||||||||
|
||||||||||||||||||||||||||||||||||||||||||||||||||||||||||||||||||||||||||||||||||||||||